Observability: logs vs metrics vs traces, and what you need
Metrics say something's wrong, logs say what happened, traces say where. You need all three - emit them with OpenTelemetry, then control cost at the pipeline.
5 min read
Observability comes down to three signals that answer three different questions - metrics tell you that something is wrong, logs tell you what happened, and traces tell you where, across your services. You need all three, and the modern move is to emit them with OpenTelemetry and then aggressively control cost at the pipeline, not by dropping a pillar. The mistake teams make isn't choosing the wrong tool; it's having a gap - great dashboards but no traces, so an incident turns into hours of guessing which service is slow. The second mistake is the opposite: instrument everything, keep everything, and watch the observability bill outgrow the infrastructure it's watching. The goal is complete coverage with disciplined cost.
Why this matters now
Two forces make this a live decision in 2026. First, OpenTelemetry (OTel) has become the default - a vendor-neutral, open-source standard with auto-instrumentation for every major language that emits metrics, logs, and traces in one format (OTLP). For any new instrumentation work, it's the correct starting point, because it decouples collecting telemetry from whichever backend you send it to - no lock-in.
Second, cost is exploding. Telemetry volume is trending 5-10x, and high-cardinality metrics are the single most common cause of runaway observability spend. So the question stopped being "which of the three pillars do I need" (all of them) and became "how do I keep all three without the bill eating me alive."
The three pillars, precisely
Each signal answers a question the others can't, which is why a setup missing one has a blind spot that only hurts during a real incident.
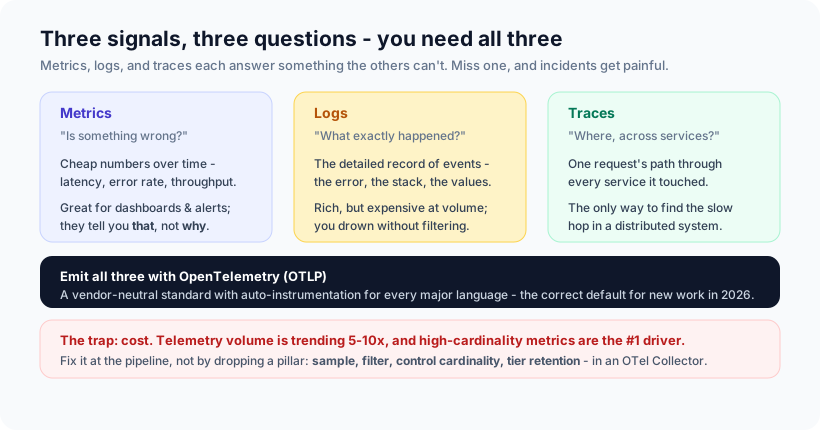
- Metrics - "is something wrong?" Cheap, aggregated numbers over time: latency, error rate, throughput, saturation. They're what dashboards and alerts run on. Their limit: they tell you that something changed, not why.
- Logs - "what exactly happened?" The detailed, per-event record: the error message, the stack trace, the specific values. Indispensable for the why, but the most expensive at volume - unfiltered logging is how observability bills balloon.
- Traces - "where, across services?" A single request's journey through every service it touched, with timing at each hop. In a distributed system, traces are the only way to find which service turned a fast request slow. Without them, a cross-service latency bug is a guessing game.
The mechanism: an incident needs all three
Here's why the "just use metrics" or "just use logs" shortcuts fail. Picture a real incident: a metric alert fires (metrics: error rate up, that). You open a trace to see the request path and find one downstream service adding 800ms (traces: where). You pull that service's logs for the failing requests and see a timeout on a specific dependency (logs: what). Remove any one signal and that chain breaks - you know something's wrong but not where, or where but not what. The three aren't redundant; they're a sequence.
The three pillars aren't three ways to see the same thing. They're three different questions, asked in order, during the ten minutes when your system is down and every minute costs you. A gap in one is a gap in the sequence.
Controlling the cost without a blind spot
You don't fix observability cost by deleting a pillar - you fix it at the pipeline:
- Sample traces. You rarely need 100% of traces; keep a representative sample plus all the errors and slow outliers. This is the biggest lever.
- Filter logs before they land. Drop the debug noise, keep the signal - at ingest, not after you've paid to store it.
- Control metric cardinality. High-cardinality labels (user IDs, request IDs on metrics) are the #1 cost driver. Keep labels bounded; put the high-cardinality detail in traces and logs where it belongs.
- Tier retention. Keep recent data hot and searchable; roll older data to cheap cold storage.
The clean way to do all of this is an OTel Collector deployed between your apps and your backend - an agent/gateway that samples, filters, and reshapes telemetry before you pay to store it.
Our opinion
Our take: instrument all three from the start with OpenTelemetry, and treat cost control as a first-class part of the setup, not a cleanup you do after the bill shocks you. The two failure modes we see are mirror images - the team that skimped and can't debug a distributed incident, and the team that instrumented everything and is now paying more to watch the system than to run it. Both are avoidable with the same decision: complete coverage, OTel as the pipe, and sampling plus cardinality discipline from day one.
We'd also argue for OTel specifically because it's the choice that ages well. Telemetry is sticky - once you're emitting in a vendor's proprietary format, switching backends means re-instrumenting everything. OTel keeps that door open: change your backend without touching your code. This is the same infrastructure-you-can-operate instinct behind our take on cloud cost - build it so it's cheap to run and cheap to change.
How Ashvara helps
We build and run cloud infrastructure, and observability done right is squarely our work: OpenTelemetry instrumentation across all three signals, an OTel Collector tuned for sampling and cardinality control, dashboards and alerts on the metrics that matter, and traces wired so a distributed incident is a five-minute investigation instead of a five-hour one - without a telemetry bill that outgrows the app.
If you're flying blind in production, or drowning in an observability bill, that's our DevOps and cloud work. Talk to us and we'll get you complete coverage you can actually afford.
Source: OpenTelemetry as the 2026 vendor-neutral standard (metrics/logs/traces over OTLP) and observability cost/cardinality guidance - see the OpenTelemetry optimization guide.