Why Postgres falls over at 200 connections
Postgres gives every connection its own operating-system process. That one fact explains the crash, why raising the limit backfires, and what a pooler fixes.
10 min read
Postgres does something most databases don't: it starts a whole separate operating-system process for every single connection. Not a thread, not a lightweight handle — a process, with its own memory. Once you know that, everything else makes sense: why the database falls over at a few hundred connections, why raising the limit makes things worse rather than better, and why almost every serious Postgres setup has a connection pooler sitting in front of it. This post explains the whole thing in plain language, with the arithmetic written out.
The one fact that explains everything
Here's how Postgres describes its own design:
PostgreSQL implements a "process per user" client/server model. In this model, every client process connects to exactly one backend process… Whenever it detects a request for a connection, it spawns a new backend process.
Read that again, because it's the whole article. One connection, one process.
A useful way to picture it: imagine a restaurant where every guest who walks in is assigned their own private waiter for the entire evening. Not a waiter shared across tables — a dedicated one, who stands there the whole time, including the forty minutes you spend chatting after the plates are cleared. Ten guests, ten waiters. Two hundred guests, two hundred waiters. The kitchen might be perfectly capable of cooking for two hundred people, but you have run out of staff long before you run out of stoves.
Most connections spend the overwhelming majority of their life doing absolutely nothing — sitting open, idle, waiting for the next query. Each one still has a process holding memory the whole time.
The arithmetic that actually kills you
Here's the part that surprises people, because nobody is doing anything unreasonable.
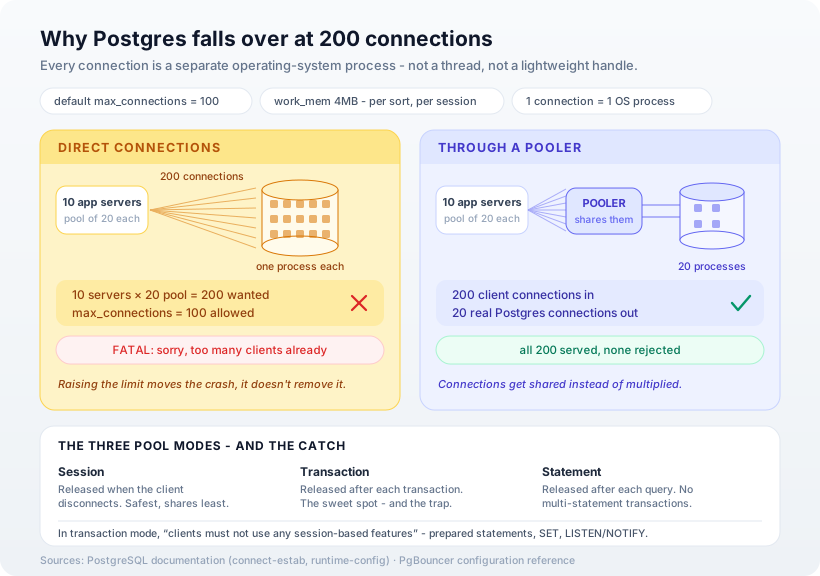
Say you run a booking app for a chain of yoga studios. Nothing exotic. You have 10 application servers behind a load balancer, and each one is configured with a connection pool of 20 — a totally normal default that ships with most web frameworks.
10 servers × 20 connections each = 200 connections
Now, the Postgres default:
The default is typically 100 connections.
You are at double the limit before a single customer has opened the app. Nobody made a bad decision. Ten servers is modest, a pool of 20 per server is the framework default, and 100 is the database default. Multiply the defaults together and you get an outage.
What you see when you cross the line is this:
FATAL: sorry, too many clients already
And it's worse than a clean failure, because the app servers that already grabbed their connections keep working fine. Only the new ones fail. So a deploy that adds two servers takes down the two newest servers while the dashboard shows the database at 30% CPU and everything looking healthy. That's what makes this bug so confusing the first time you meet it.
"So I'll just raise max_connections"
This is everyone's first instinct, and it's a trap. Postgres warns about it directly:
PostgreSQL sizes certain resources based directly on the value of
max_connections. Increasing its value leads to higher allocation of those resources, including shared memory.
But the real problem is the memory each connection can grab once it's actually doing something. There's a setting called work_mem, and the docs are refreshingly blunt about how it adds up:
The default value is four megabytes (
4MB). Note that a complex query might perform several sort and hash operations at the same time, with each operation generally being allowed to use as much memory as this value specifies… Also, several running sessions could be doing such operations concurrently. Therefore, the total memory used could be many times the value ofwork_mem.
So work_mem is not 4MB per server, or 4MB per connection. It's 4MB per sorting operation, per connection, at the same time.
Back to the yoga studio. Your monthly report query has an ORDER BY, a GROUP BY and a join — three operations that can each claim work_mem. If 100 connections happen to run something like that at once:
100 connections × 3 operations × 4MB = 1.2 GB
That's 1.2 GB of memory that isn't your cache, isn't your data, and appears out of nowhere the first time a lot of people load the reports page together. Raise max_connections to 500 and you've raised the ceiling on that number too. You haven't fixed the crash, you've just moved it somewhere harder to diagnose — and swapped a clear error message for the Linux out-of-memory killer terminating your database mid-query.
The fix: stop giving everyone their own waiter
A connection pooler is a small piece of software that sits between your app and the database. Your 200 app connections all connect to the pooler. The pooler keeps a much smaller number of real connections to Postgres — say 20 — and lends them out as needed.
It works because, as we said, most connections are idle most of the time. Twenty real connections can comfortably serve two hundred app connections, in the same way that twenty waiters can serve two hundred guests as long as they're not all ordering in the same second. You get a maître d' instead of a private waiter each.
The most common pooler is PgBouncer, and it's deliberately tiny — it does this one job. Most managed Postgres providers now include a pooler as a checkbox or an alternate connection string, so in many cases adopting one means changing a port number in your config, not deploying new infrastructure.
Three modes, and the one that bites
This is the part worth understanding before you flip the switch, because one of these options silently breaks things. Straight from PgBouncer's documentation:
- Session — "Server is released back to pool after client disconnects." This is the default, and it's the safest. It also shares the least: a client that connects and sits idle still ties up a real connection. Good for correctness, limited help for the problem you're solving.
- Transaction — "Server is released back to pool after transaction finishes." This is where the big win is. A connection is only held for the duration of an actual transaction, so a handful of real connections can serve a very large number of clients.
- Statement — "Server is released back to pool after query finishes. Transactions spanning multiple statements are disallowed in this mode." Maximum sharing, and you give up multi-statement transactions to get it. Niche.
Almost everyone wants transaction mode. And here is the catch, again in the documentation's own words:
Clients must not use any session-based features, since each transaction ends up in a different connection and thus gets a different session state.
In plain English: in transaction mode, two queries in a row may land on two completely different database connections. So anything where one query sets something up and a later query depends on it will break. That includes prepared statements, session-level SET commands, LISTEN/NOTIFY, and advisory locks held across statements.
This matters more than it sounds, because many database libraries use prepared statements automatically, without telling you. The failure mode is nasty: everything works in development (one process, low concurrency, connections rarely get shuffled) and then throws intermittent errors in production under load. If you switch to transaction mode, check your database driver's docs for how to disable prepared statements — it's usually one flag, and it's the single most common cause of "the pooler broke everything." We flagged the same trap when explaining Supabase, because its pooled connection string runs in exactly this mode.
The serverless version of the same problem
If you're on serverless functions, this problem arrives much earlier and much harder — because scaling is the whole point of the platform.
Every function instance that spins up opens its own connection. A traffic spike that starts 300 concurrent instances tries to open 300 connections, against a default budget of 100. Your database is now being attacked by your own success, and the usual advice ("reuse the connection across invocations") only helps within a single instance — it does nothing about the number of instances.
A pooler isn't optional here, it's a prerequisite. This is one of the few places where the architecture genuinely forces your hand.
What to actually do
- Work out your real number. Servers × pool size per server. Add background workers, cron jobs, migration tasks, and anyone connecting with a SQL client. This number is almost always bigger than people guess.
- Compare it to
max_connections. If it's close, you already have an incident scheduled, you just don't know the date. - Put a pooler in front, in transaction mode. Then shrink the pool size in your app — with a pooler doing the sharing, each app server needs far fewer.
- Turn off prepared statements in your driver at the same time, in the same change. Doing these separately is how you get a mysterious Tuesday.
- Leave
max_connectionsalone unless you have measured memory headroom to back it up. - Watch idle connections, not just active ones. A pile of connections sitting in
idle in transactionis a leak in your code, and no pooler will save you from it.
Our opinion
The instinct to raise max_connections isn't stupid — it's just treating a symptom that looks exactly like the disease. The error says "too many clients," so you allow more clients. It's the obvious move, and it works for about a week, which is the worst possible outcome because it teaches you the wrong lesson.
Our rule: the number of connections your app opens should be a deliberate decision, not the product of three unrelated defaults multiplied together. Almost every case we've seen came from nobody choosing 200 — it just emerged from a framework default times a deploy-size default. Write the number down. If you can't say what it is off the top of your head, that's the finding.
We'd also push back gently on treating this as a reason to move off Postgres. It isn't. The process-per-connection model is the same design that gives Postgres its rock-solid isolation between queries, and one badly-behaved query can't corrupt the memory of another. It's a real trade-off with a well-understood, one-component fix. Postgres remains the right default for the overwhelming majority of applications, for all the reasons we've written about before.
How Ashvara helps
We size connection budgets as part of designing a system rather than discovering them during an incident — pooler in front, transaction mode configured properly, driver settings that match it, and monitoring on idle connections so a leak shows up as a graph instead of an outage.
That's everyday backend and API work for us. If your database falls over when you scale up and the CPU graph looks fine the whole time, tell us what you're seeing — it's usually this, and it's usually a short fix.
Sources: PostgreSQL documentation — connection establishment, connection settings, and resource consumption; PgBouncer configuration reference. Defaults differ on managed Postgres — check your provider's settings.